Usecase
Real-time code coverage analysis
Role
Product Design Lead
Duration
4 Agile sprints
Responsibilities
Research & Strategy
Product Design
Outcome / KPIs
Increased task success rate
Increased user satisfaction score
Better usability in A/B tests
Product Design Lead
Duration
4 Agile sprints
Responsibilities
Research & Strategy
Product Design
Outcome / KPIs
Increased task success rate
Increased user satisfaction score
Better usability in A/B tests
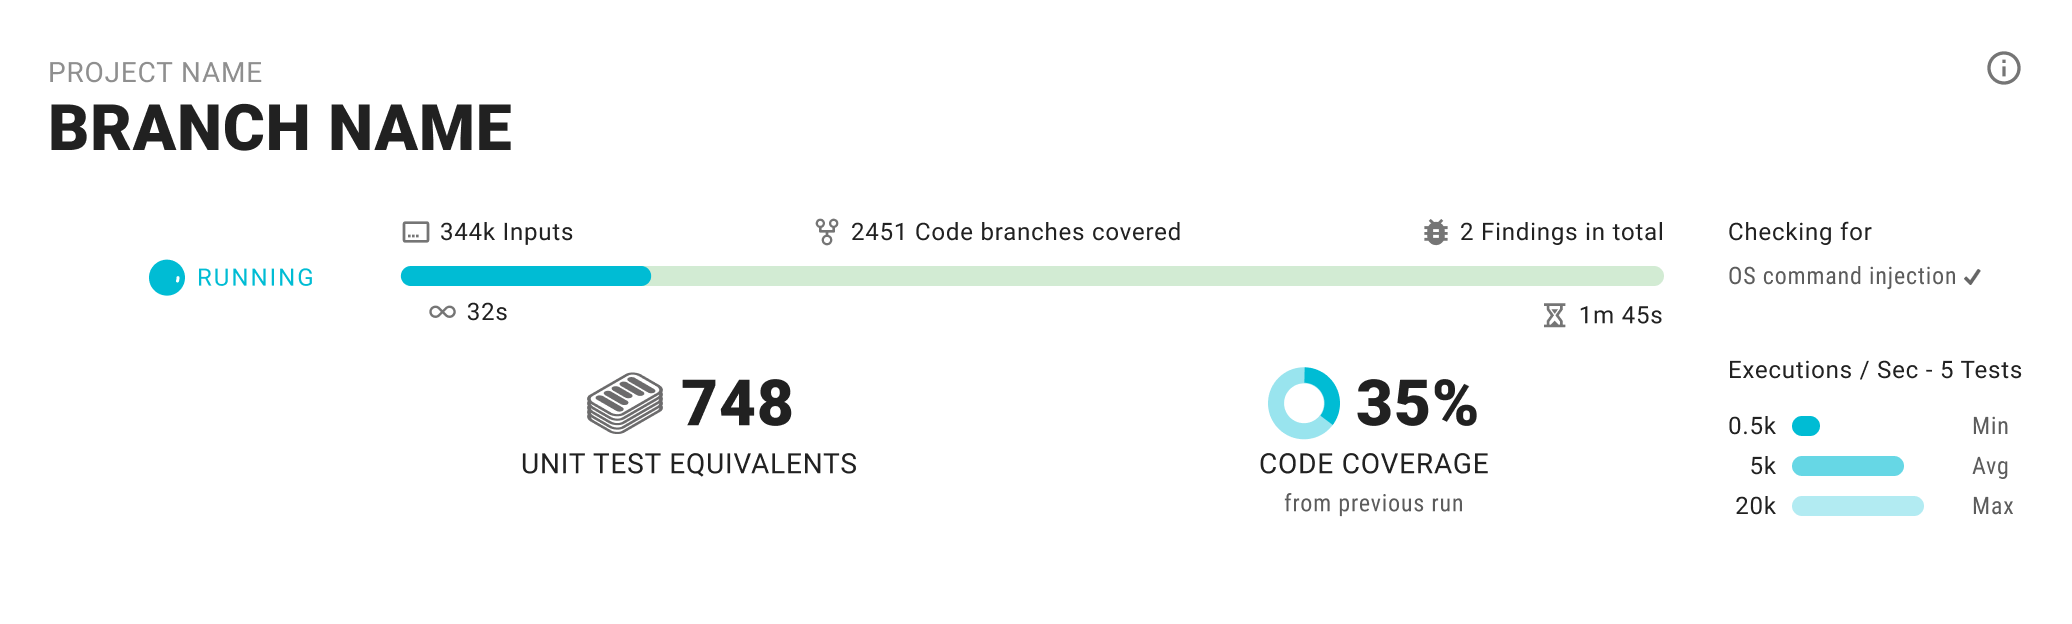
One thing that really bothers developers is the need for immediate feedback on code coverage metrics while running tests. It's super important for developers to be able to quickly make informed decisions, improve their testing processes in real-time, and allocate resources effectively to boost code quality and speed up development cycles.
Continuous Discovery
Research and analysis
User data through qualitative feedback
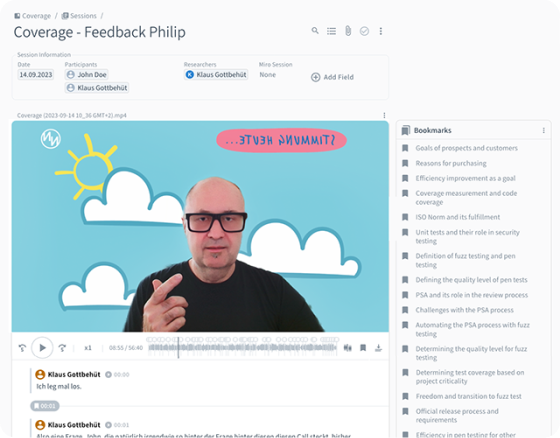
This feature is the result of regular interviews followed by analysis and synthesis of the results.
I used the findings from the interviews with our customer success engineers to compare them with the existing user journey. This revealed a number of interesting pain points on the overview page in CI Sense.
Focusing on the Developer, Team Leader and Manager personas, I updated the existing user journey. I then created a list of challenges in chronological order of the user journey and prioritized them. I focused only on the selected personas.
Identified user problems (pain points)
Long waiting times for test results
Users had to wait until all tests were completed to evaluate code coverage, which slowed down the development process.
Users had to wait until all tests were completed to evaluate code coverage, which slowed down the development process.
Unclear test coverage during testing
Developers did not have immediate feedback on code coverage during test execution, which could lead to inefficient test strategies.
Developers did not have immediate feedback on code coverage during test execution, which could lead to inefficient test strategies.
Lack of objective
There was no possibility to set specific coverage goals and monitor them during the test execution.
There was no possibility to set specific coverage goals and monitor them during the test execution.
Resource inefficiency
Without real-time insights, it was difficult to optimize test resources and prioritize tests that provide the most code coverage.
Without real-time insights, it was difficult to optimize test resources and prioritize tests that provide the most code coverage.
Mapping to user needs
Real-time metrics
The system must be able to calculate and display test metrics during test execution.
The system must be able to calculate and display test metrics during test execution.
Automatic coverage update
The coverage should be automatically and continuously updated as new code paths are discovered.
The coverage should be automatically and continuously updated as new code paths are discovered.
Set and monitor coverage goals
Users should be able to set specific coverage goals (e.g. percentage values) and monitor their achievement in real-time.
Users should be able to set specific coverage goals (e.g. percentage values) and monitor their achievement in real-time.
Optimized test resource distribution
The system should prioritize tests and distribute resources in a way that prioritizes tests with the highest impact on code coverage.
The system should prioritize tests and distribute resources in a way that prioritizes tests with the highest impact on code coverage.
User-friendly interface
The solution must provide an intuitive user interface that makes it easy to understand and utilize real-time data and coverage metrics.
The solution must provide an intuitive user interface that makes it easy to understand and utilize real-time data and coverage metrics.
Ideation
Concept
In brainstormings, I have depicted the current functionality and listed existing metrics. I have compared ideas that solve the actual user problems found in our discovery and fullfil user needs in a Now/Future matrix.
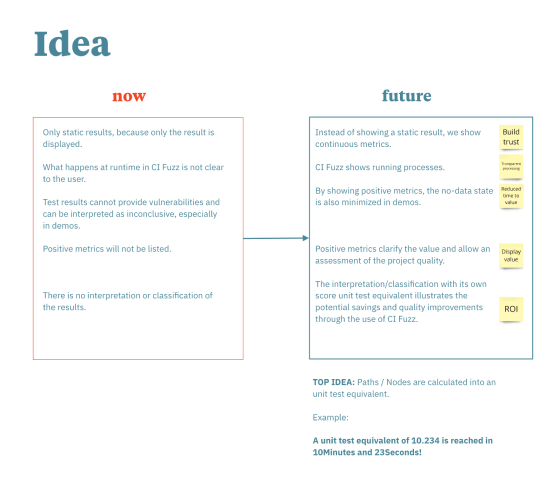
Actual state
What happens at runtime in CI Fuzz is not clear to the user
Only static results, because only the result is displayed
Test results cannot provide vulnerabilities and can be interpreted as inconclusive, especially in demos
Positive metrics will not be listedThere is no interpretation or classification of the results
Desired state
CI Fuzz displays running processes
Instead of showing a static result, we show continuous metrics
By showing positive metrics, the no-data state is also minimized in demos
Positive metrics clarify the value and allow an assessment of the project quality
The interpretation / classification with its own score (unit test equivalent) illustrates the potential savings and quality improvements through the use of CI Fuzz
Hypothesis
"We believe that immediate feedback on code coverage metrics while running tests for developers will increase the usage of CI Sense."
"We will know this is true when we see a 15% increase in the task success rate and a 10% increase in user satisfaction."
"We will know this is true when we see a 15% increase in the task success rate and a 10% increase in user satisfaction."
Creation
Design
I used wireframes to sketch the desired state and visualize possible features. After lively discussions and exchanges with the teams, we agreed on the most important features needed in the first release to solve the most important user problems.
This was a collaborative and cross-functional team effort.
This was a collaborative and cross-functional team effort.

Steps - Responsible teams
Develop a new synthetic metric (ratio of fuzz tests executed to unit tests) - Product team
Real-time code coverage calculation - Fuzzing team
Display of executed test validators - Backend team
New metrics in a dashboard card - Product team
Animation of test status and chart with metrics on a dashboard card - Frontend team
Outcome
New functions
Visual Proposals - A lot of iterations
Visual Proposals - A lot of iterations
Validation
We reviewed the results in interviews with success engineers and selected customer stakeholders. We took the feedback and implemented it where necessary.
Delivery
Outcome
Upon completion of the iterations, the approved proposal was coded by the development teams. The initial release was continuously developed and released.
How to measure success of this feature?
How do we know that the solution was successful? We decided, in a first step, to evaluate the following metrics of behavioral and attitudinal user feedback against the following metrics.
1. Primary Metric: Task success rate
2. Secondary Metric: User satisfaction score
3. Qualitative Feedback: User feedback from interviews
1. Primary Metric: Task success rate
2. Secondary Metric: User satisfaction score
3. Qualitative Feedback: User feedback from interviews
Research plan
1. Methodology: Usability testing, surveys
2. Participants: Success engineers, developers, team lead, manager
3. Timeline: 14 days / fortnight
2. Participants: Success engineers, developers, team lead, manager
3. Timeline: 14 days / fortnight

Post mortem
Celebrate!
Learning experiences and possibilities for improvement are being discussed in dedicated retrospectives. We celebrate the success with the complete team!
©2024 Klaus Gottbehüt - Yes, made with